2017 UK General Election Infographic
Creative Disciplines: Data Visualisation, Infographics, Graphic Design
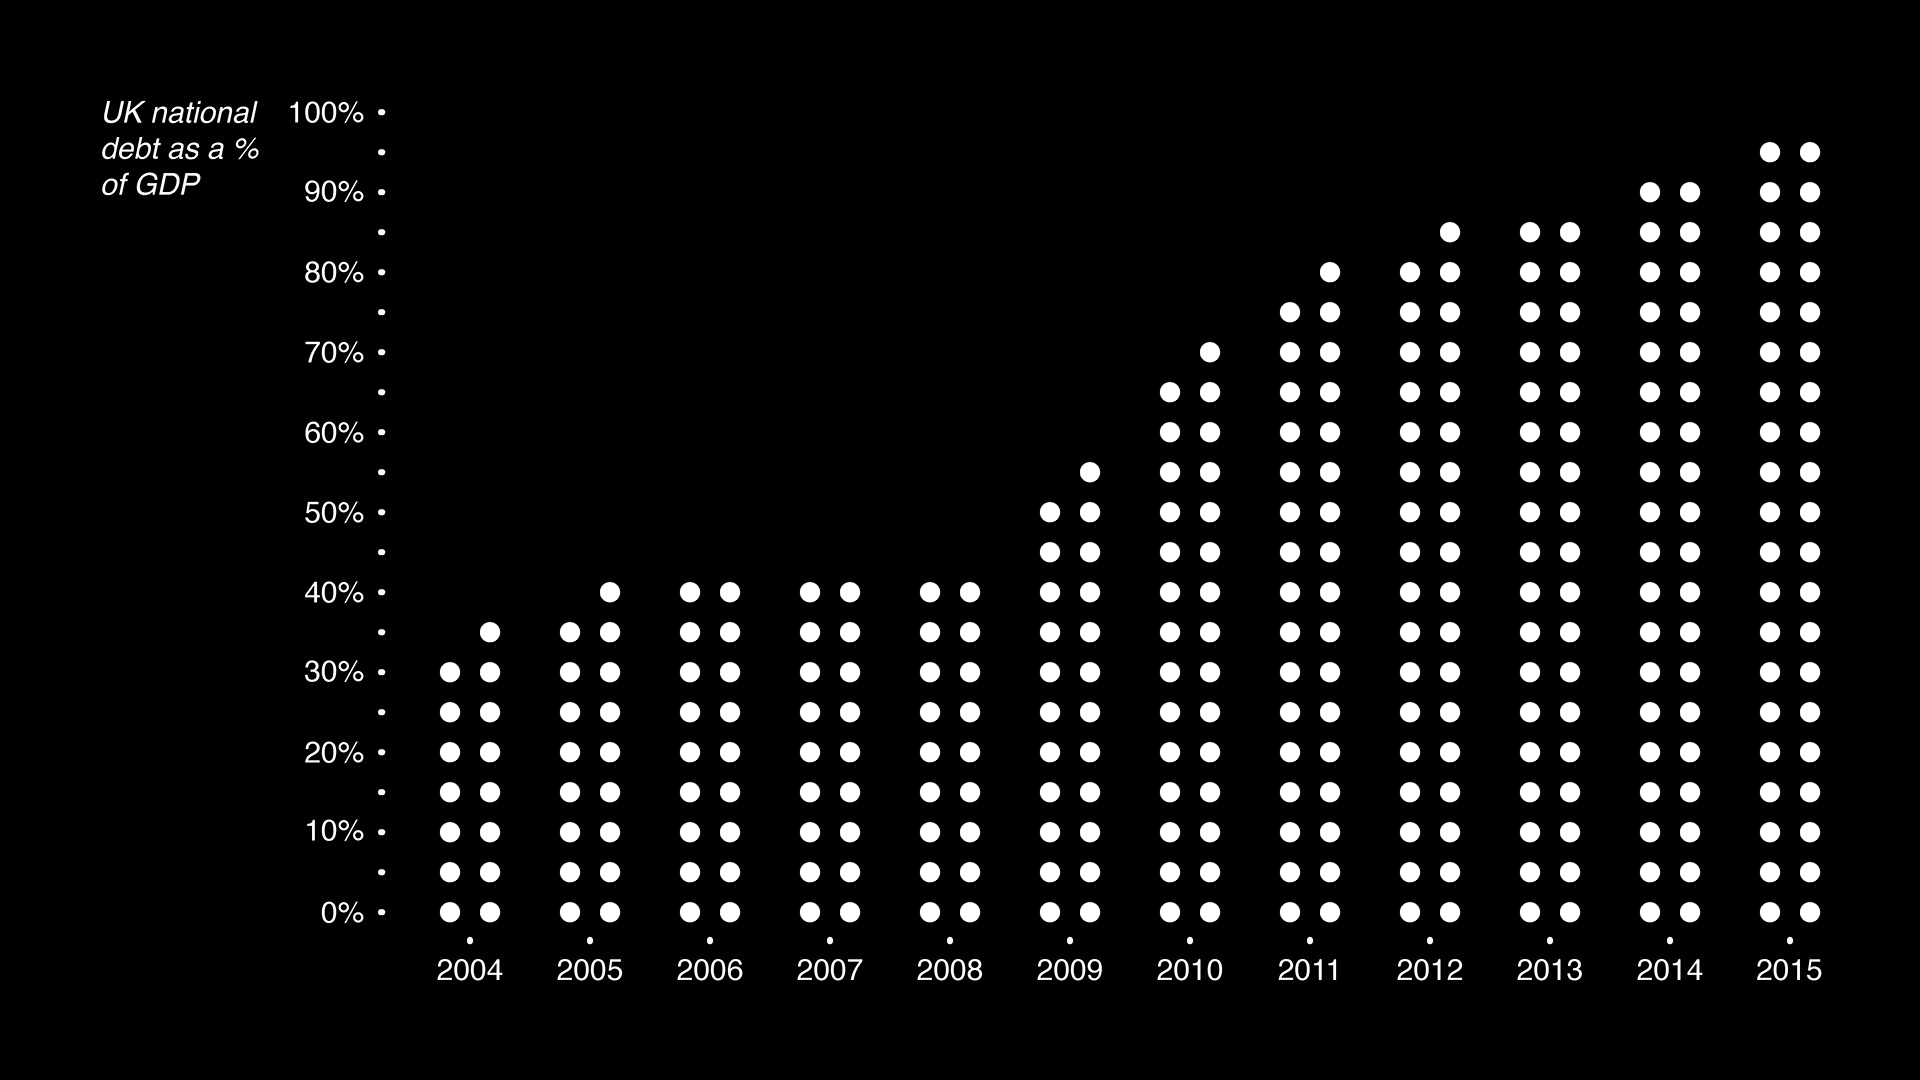
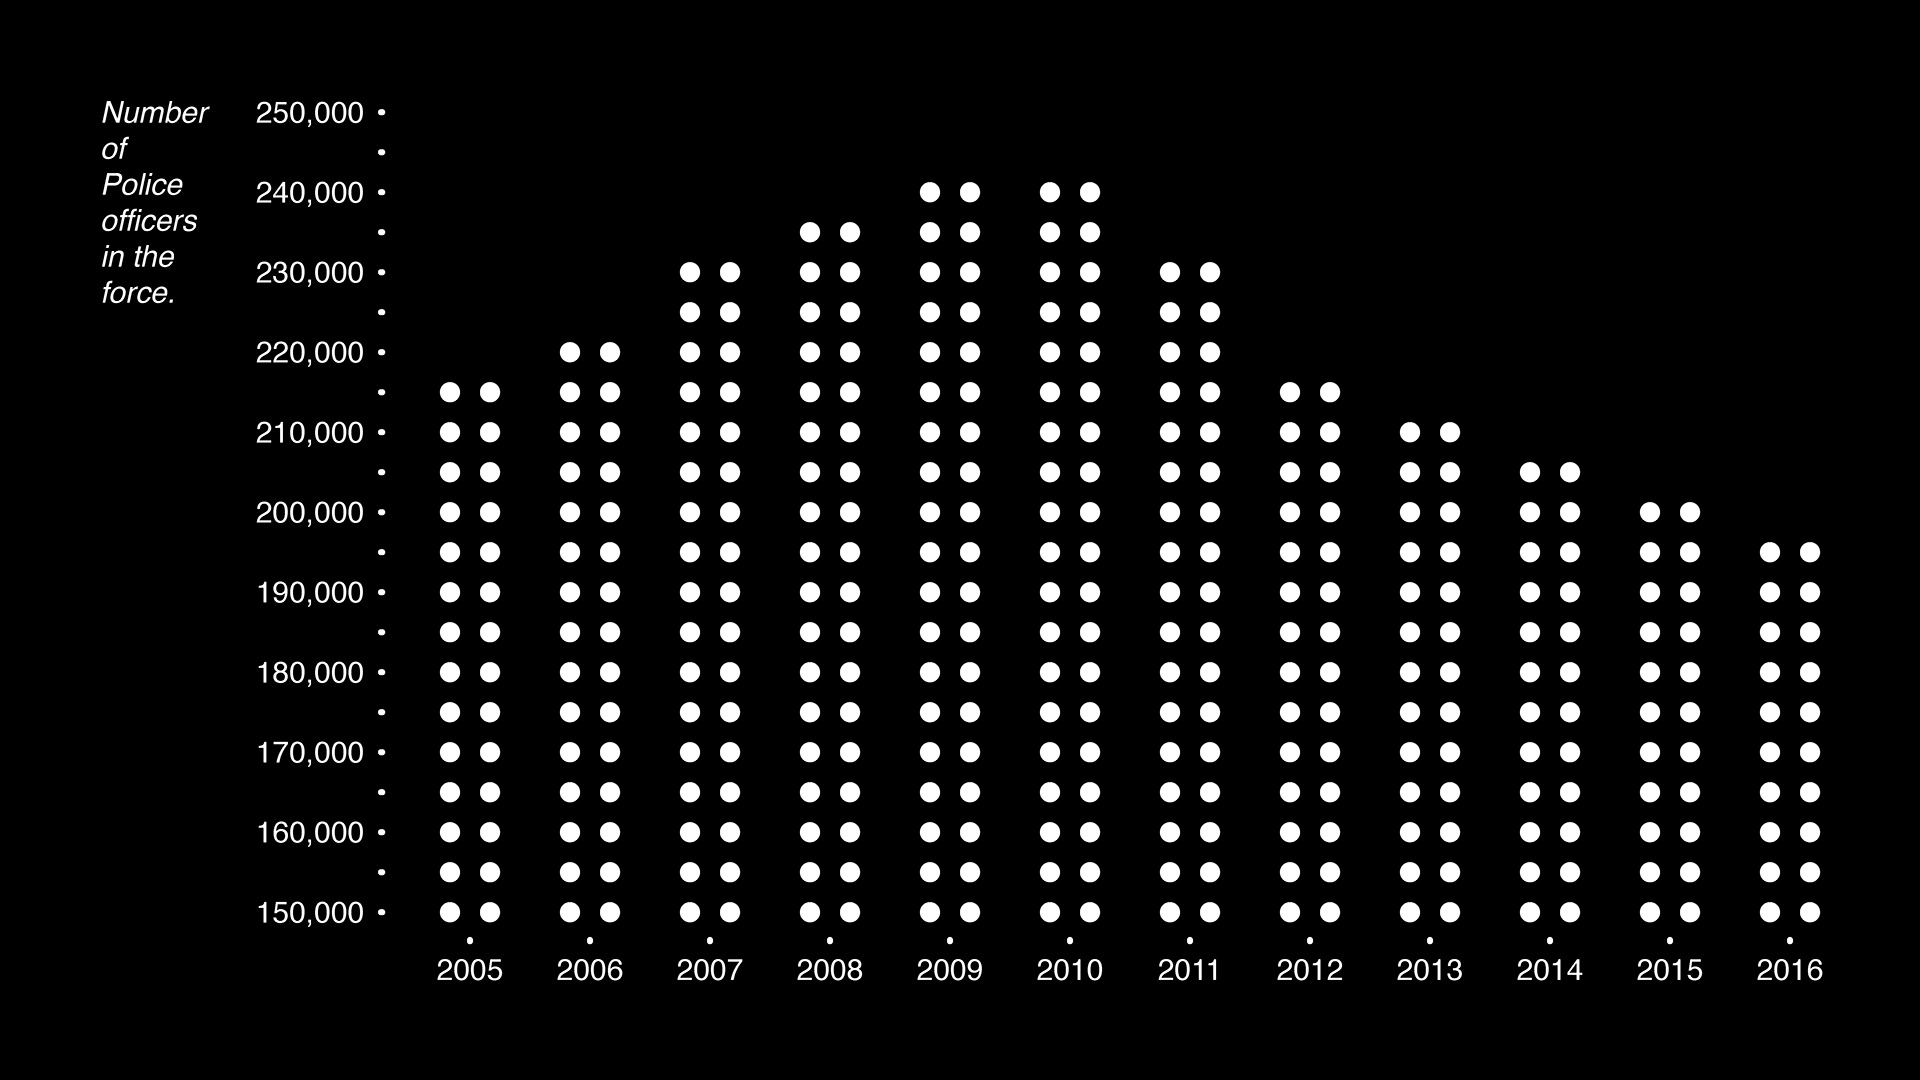
With the 2017 general election looming I wanted to produce an infographic that cuts out the political jargon, I wanted to produce an infographic that didn’t scaremonger and I wanted to produce an Infographic that simply laid the facts bare so that the viewer was able to make up their own mind.
With the 2017 general election looming I wanted to produce an infographic that cuts out the political jargon, I wanted to produce an infographic that didn’t scaremonger and I wanted to produce an Infographic that simply laid the facts bare so that the viewer was able to make up their own mind.
Living in a world of fake news and political chicanery I wanted to my bit and attempt to help try and set the record straight. It had been 9 years since the crash in 2008 and for some times have been hard, high streets have been hit and right-wing populism had been on the rise. With working-class people increasingly finding harder and harder times certain people in Westminster and Media found it was all too easy to find a scape Goat, this scape Goat came in the form of the EU, EU migrants and the Labour party of Tony Blair and Gordon Brown. Extreme austerity measures were implemented, food banks become apart of the national discourse and public services saw cutbacks which lead to a rise in knife crime, terrorism, and suicide.
Living in a world of fake news and political chicanery I wanted to my bit and attempt to help try and set the record straight. It had been 9 years since the crash in 2008 and for some times have been hard, high streets have been hit and right-wing populism had been on the rise. With working-class people increasingly finding harder and harder times certain people in Westminster and Media found it was all too easy to find a scape Goat, this scape Goat came in the form of the EU, EU migrants and the Labour party of Tony Blair and Gordon Brown. Extreme austerity measures were implemented, food banks become apart of the national discourse and public services saw cutbacks which lead to a rise in knife crime, terrorism, and suicide.
With political reputations at stake, tempers were high and the language became more abrasive, the news was shared weather it was real or not and integrity hit an all-time low. For me as a Brit, it is deeply sad to see a nation with such a proud history as our own tear it’s self apart and become polarised, rational and well-informed conversation went out of fashion faster than flairs and we seemed to only talk emotionally. I wanted to try to help reset the needle, I wanted to produce an infographic that was for every age range, easily digestible and informative. I set about researching what went on over the past 7 years and how we ended up in the hole that we found ourselves in.
Due to the shocking data that went into the infographic, I didn’t feel the need to overemphasize the design through visual aid or sound, I wanted it to remain neutral, refined and beautiful, by having black as the base colour and not adding sound the infographic became sincere, I created a dot grid to base the visual around to juxtapose the sincerity and add an essence of friendliness to the data and optimized the design for mobile as well as desktop.
Since the release of this infographic, it has been picked up by Ian Mitchell at the Liverpool School of Art & Design and is currently being used as research as a way to visually communicate complexity both at the university and the 2CO Communicating Complexity design conference. I would just like to take a moment to thank Ian for his kind words and support.


Infographic Sources:
National Debt // http://www.economicshelp.org/blog/334/uk-economy/uk-national-debt/
NHS Deficit // http://www.bbc.co.uk/news/health-39029265
Police Officers // https://www.gov.uk/government/publications/police-workforce-england-and-wales-31-march-2015/police-workforce-england-and-wales-31-march-2015
Food Banks // https://www.trusselltrust.org/news-and-blog/latest-stats/end-year-stats/#fy-2016-2017
Homeless People // http://www.homeless.org.uk/facts/homelessness-in-numbers/rough-sleeping/rough-sleeping-explore-data
Nightlife // https://fullfact.org/economy/no-longer-partying-all-night-london-nightclubs-closing/
Affordable homes // http://england.shelter.org.uk/campaigns_/why_we_campaign/housing_facts_and_figures/subsection?section=housing_supply#hf_3
Tuition fees // http://www.independent.co.uk/news/uk/politics/scrap-tuition-fees-and-give-students-grants-again-says-labours-jeremy-corbyn-10392769.html
NHS waiting times // http://www.independent.co.uk/news/uk/politics/nhs-elderly-patients-increase-wait-times-18-weeks-simon-stevens-pain-discomfort-appalling-anger-a7660061.html
Health Tourism // https://fullfact.org/health/health-tourism-whats-cost/